
Power BI and the Power Apps visualization
Combining Power BI with the rest of the Power Platform, in the shape of Power Automate and Power Apps, opens up a whole new realm of possiblities in your default Power BI reports. But to do this properly, it’s nice to have an understanding of the visualization type and how it works. This post runs through the Power Apps visualization and how it integrates with Power BI.
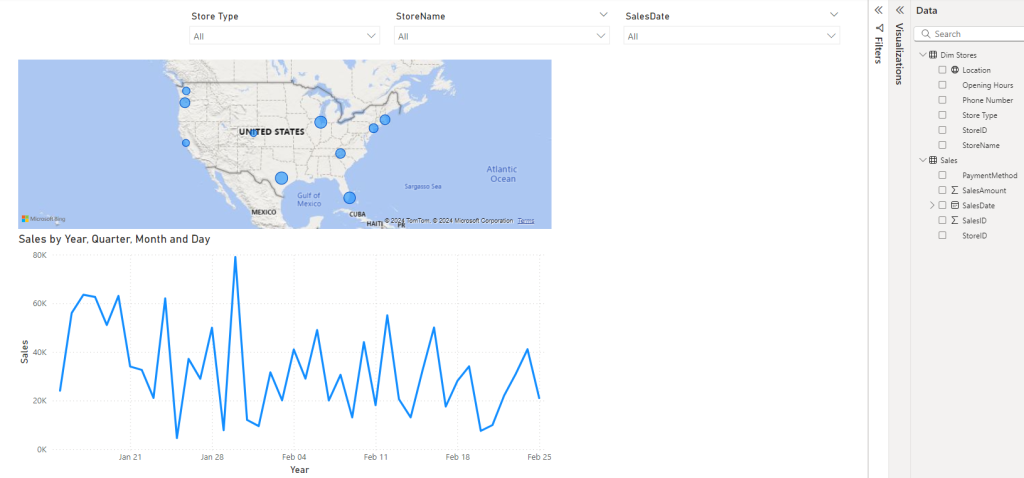
First off, I created a very very simple Power BI report, which a single dimension, Dim Stores, and a single fact, Sales – thanks to ChatGPT for generating those rows for me. The relation between the two tables is the column StoreID.
The Power Apps visualization
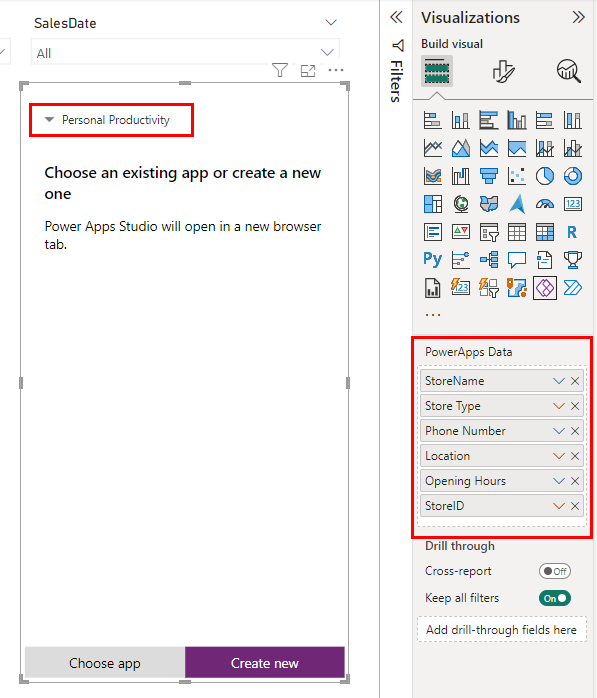
In the visualizations pane, there’s a Power Apps and a Power Automate logo, and the visualizations work very much the same way, so this post will focus on the Power Apps part. Generally, when inserted, it needs to have data inserted into it, just like any other visualization. When you add data, the UI of the visualization will change, allowing you to pick both the environment on the top left, but also taking a stance on whether you want to embed an existing application or create a new one.
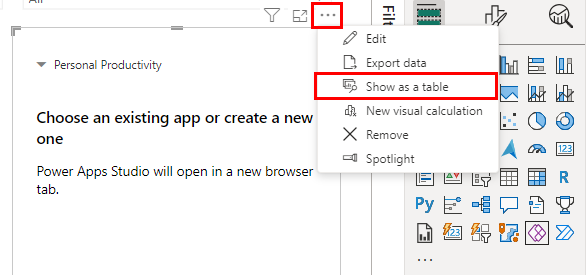
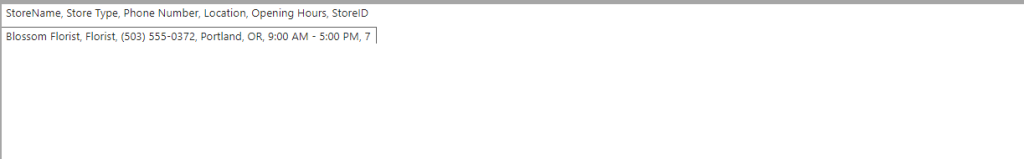
But, before jumping into the build parts, let’s first take a look at the data behind it, to understand how this visual interacts with the rest of Power BI. We can do this by pressing Show as a table, as shown below.
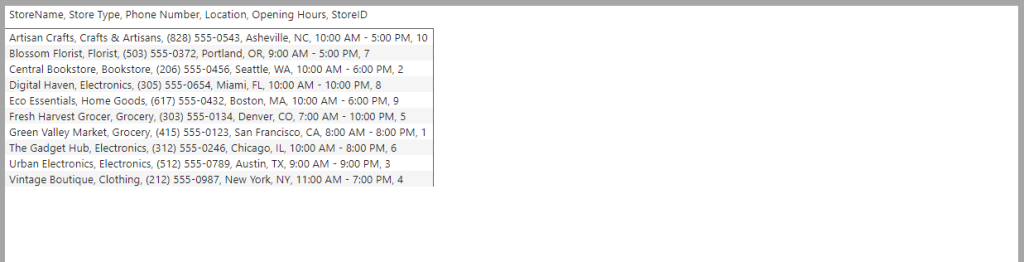
Here we now see the records that will be available to Power Apps, which gives us a bit of transparency into what Power Apps get’s to read, and how it get’s to read it. We see that the entire dataset is available here, but just the columns that we dropped in the visual. In this case I took all values from the dimension table, and there are no filters set on the report, so it shows me all 10 stores.
Selecting a store in the filter of Power BI, will change the records that are shown in the Show as a table view as well. Generally the Power Apps visualization works just like any other visual, and you could simply change it into a table or a graph as well, as you please.
Being aware of this interaction, and understanding this, can be crucial to your Power Apps & Power Automate development inside of Power BI.
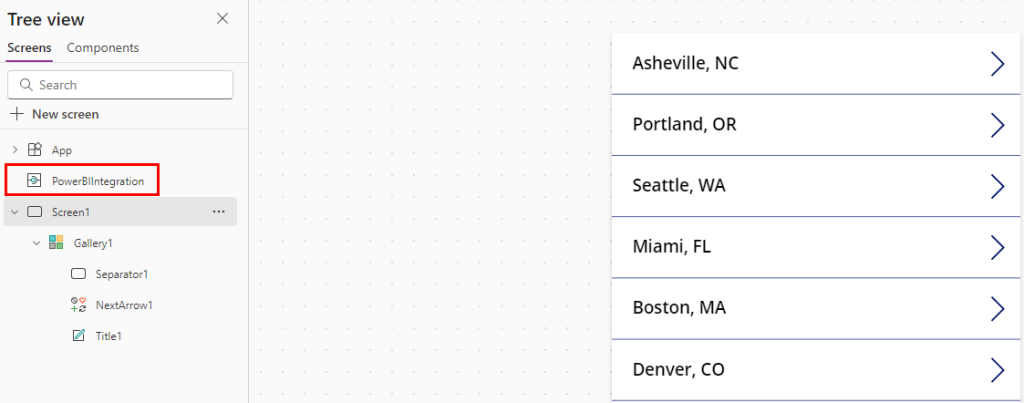
Inside Power Apps Studio & PowerBIIntegration
When creating the Power App, by pressing Create New, it’s an important note here, that it will be created with the “PowerBIIntegration”, and this is the only way of getting that part into your application. Additionally, it creates a gallery, which proves the link between Power BI and Power Apps.
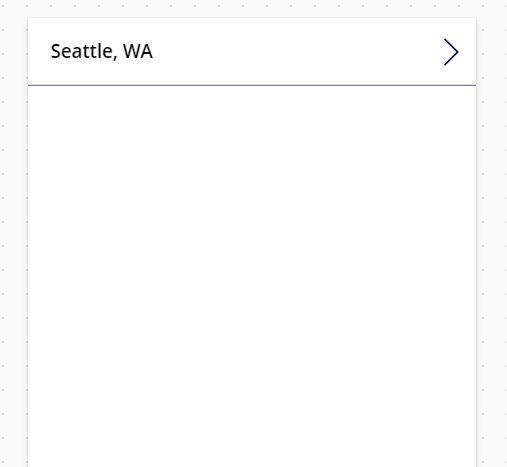
To go further with this link, if we either highlight a store or filter for a store, we will see that the Gallery inside Power Apps changes. Generally when developing Power Apps that should be embedded in Power BI, it’s easier whenever you have this link being live.
If you want to reference the data in Power BI, inside of Power Apps, you’ll be looking at PowerBIIntegration.Data – that’s where all the data is stored, and then if you’re interested in a single record, as this is a table data type, you can simply use the First() function in front, and you’ll be able to manage the whole thing from there.
Closing Thoughts
Power Apps and Power Automate inside Power BI, opens up a whole scope of things. Editing data live, inside of Power BI, reporting back on data inside of Power BI, and generating new data points, inside of Power BI. Additionally, with Power Automate we can also generate tables for e-mail sendout or teams notification, or even schedule refreshes of the data underlying Power BI, assuming it’s run in the likes of Azure Data Factory, Azure Functions or even Fabric Pipelines – they can be triggered with APIs and therefore we can do refreshes of the Power BI report we’re inside, using these functionalities as well.
A very important thing I’d like to suggest here, is always having your Power BI report published to the Power BI service, before you embed the Power Apps & Power Automate visualizations inside it, since the integration works immensely better that way.
Also, if you’re able to determine the fields you need from Power BI, before you start, so you can make sure that the fields are being made available to the Power App on your first go, that’s going to be a better experience, as changing the fields that the Power App reads can be a bit of a headache – it’s not impossible though.
Finally, remember that Power Apps generally only reads 500 rows from any data source, and this rings true for Power BI too – so even if you have 1 million rows in Power BI, made available to your Power App, it will only see the first 500. You can change this to 2.000, but no more than that, by going to the settings of the Power App inside Power Apps Studio, and navigating to the General tab, scrolling down and changing the Data Row Limit from 500 to your wanted number. Generally, I would rarely suggest changing this value, but you may have edge cases.


Thank you for such a well-explained and thorough article.
This site rocks!
Nice share!